We have been recognized in RegTech100 2026 - Strengthening leadership across AI governance, MRM and FCC

.png)
Large language models now power production workflows at most enterprises, from customer support agents to fraud investigation copilots. The architecture that runs them looks nothing like traditional software. Outputs are non-deterministic and cost scale per token. Failures show up as hallucinations, prompt-injection attacks, or quiet quality drift rather than HTTP errors.
Standard application monitoring cannot see these failure modes. LLM observability fills that gap by capturing the full request path, scoring output quality, and surfacing the regressions that matter to risk and compliance teams. The discipline has moved from a developer convenience to a board-level requirement.
This blog covers what LLM observability is, its applications, defining pillars, key metrics to track, and the observability tools enterprises should evaluate in 2026.

What Is LLM Observability?
LLM observability is the practice of capturing and analyzing every signal that comes out of a large language model in production. It goes beyond logging a prompt and a response. It traces the full path of each request, including retrieval steps, intermediate steps, API calls, and the final output.
Traditional application performance monitoring tracks logs, metrics and traces of deterministic systems. LLM observability extends that model to handle non-deterministic outputs and semantic quality scoring. It also covers the unique failure modes of generative AI, such as hallucinations and prompt injection.
The goal stays the same as any observability discipline. To detect issues fast, understand root causes and prevent recurrence. The difference is what gets measured and how teams interpret what they see across AI applications running at scale.
Why LLM Observability Matters for Enterprises?
The cost of getting LLM behavior wrong has moved from theoretical to documented across regulated industries.
- Hallucinations cost money and trust: When an LLM fabricates a fact in a customer-facing workflow, the cost lands somewhere. Refunds, churn, regulatory complaints or reputation hits all carry a price the business absorbs.
- Cost management requires token-level visibility: Token-level observability shows exactly where costs concentrate. It identifies expensive prompts, inefficient chains and token-burning loops before they drain budgets and miss financial targets.
- Regulatory pressure is rising fast: The EU AI Act, NIST AI RMF, and SR 26-02 require post-deployment monitoring for high-risk AI systems. Enterprises use observability data to generate evidence that regulators request during inspections.
- Quality degrades silently in production: AI models can change without warning, and RAG systems may stop retrieving accurate information over time. Without proper monitoring, businesses usually discover the problem only after customers report it.
- Agentic workflows multiply system complexity: A single agent task can span dozens of LLM calls, tool invocations, and decision steps. Debugging that without trace-level visibility into system behavior is impossible at production scale.
The Five Pillars of LLM Observability
Effective LLM observability depends on five pillars that work together across the production lifecycle of any AI system.
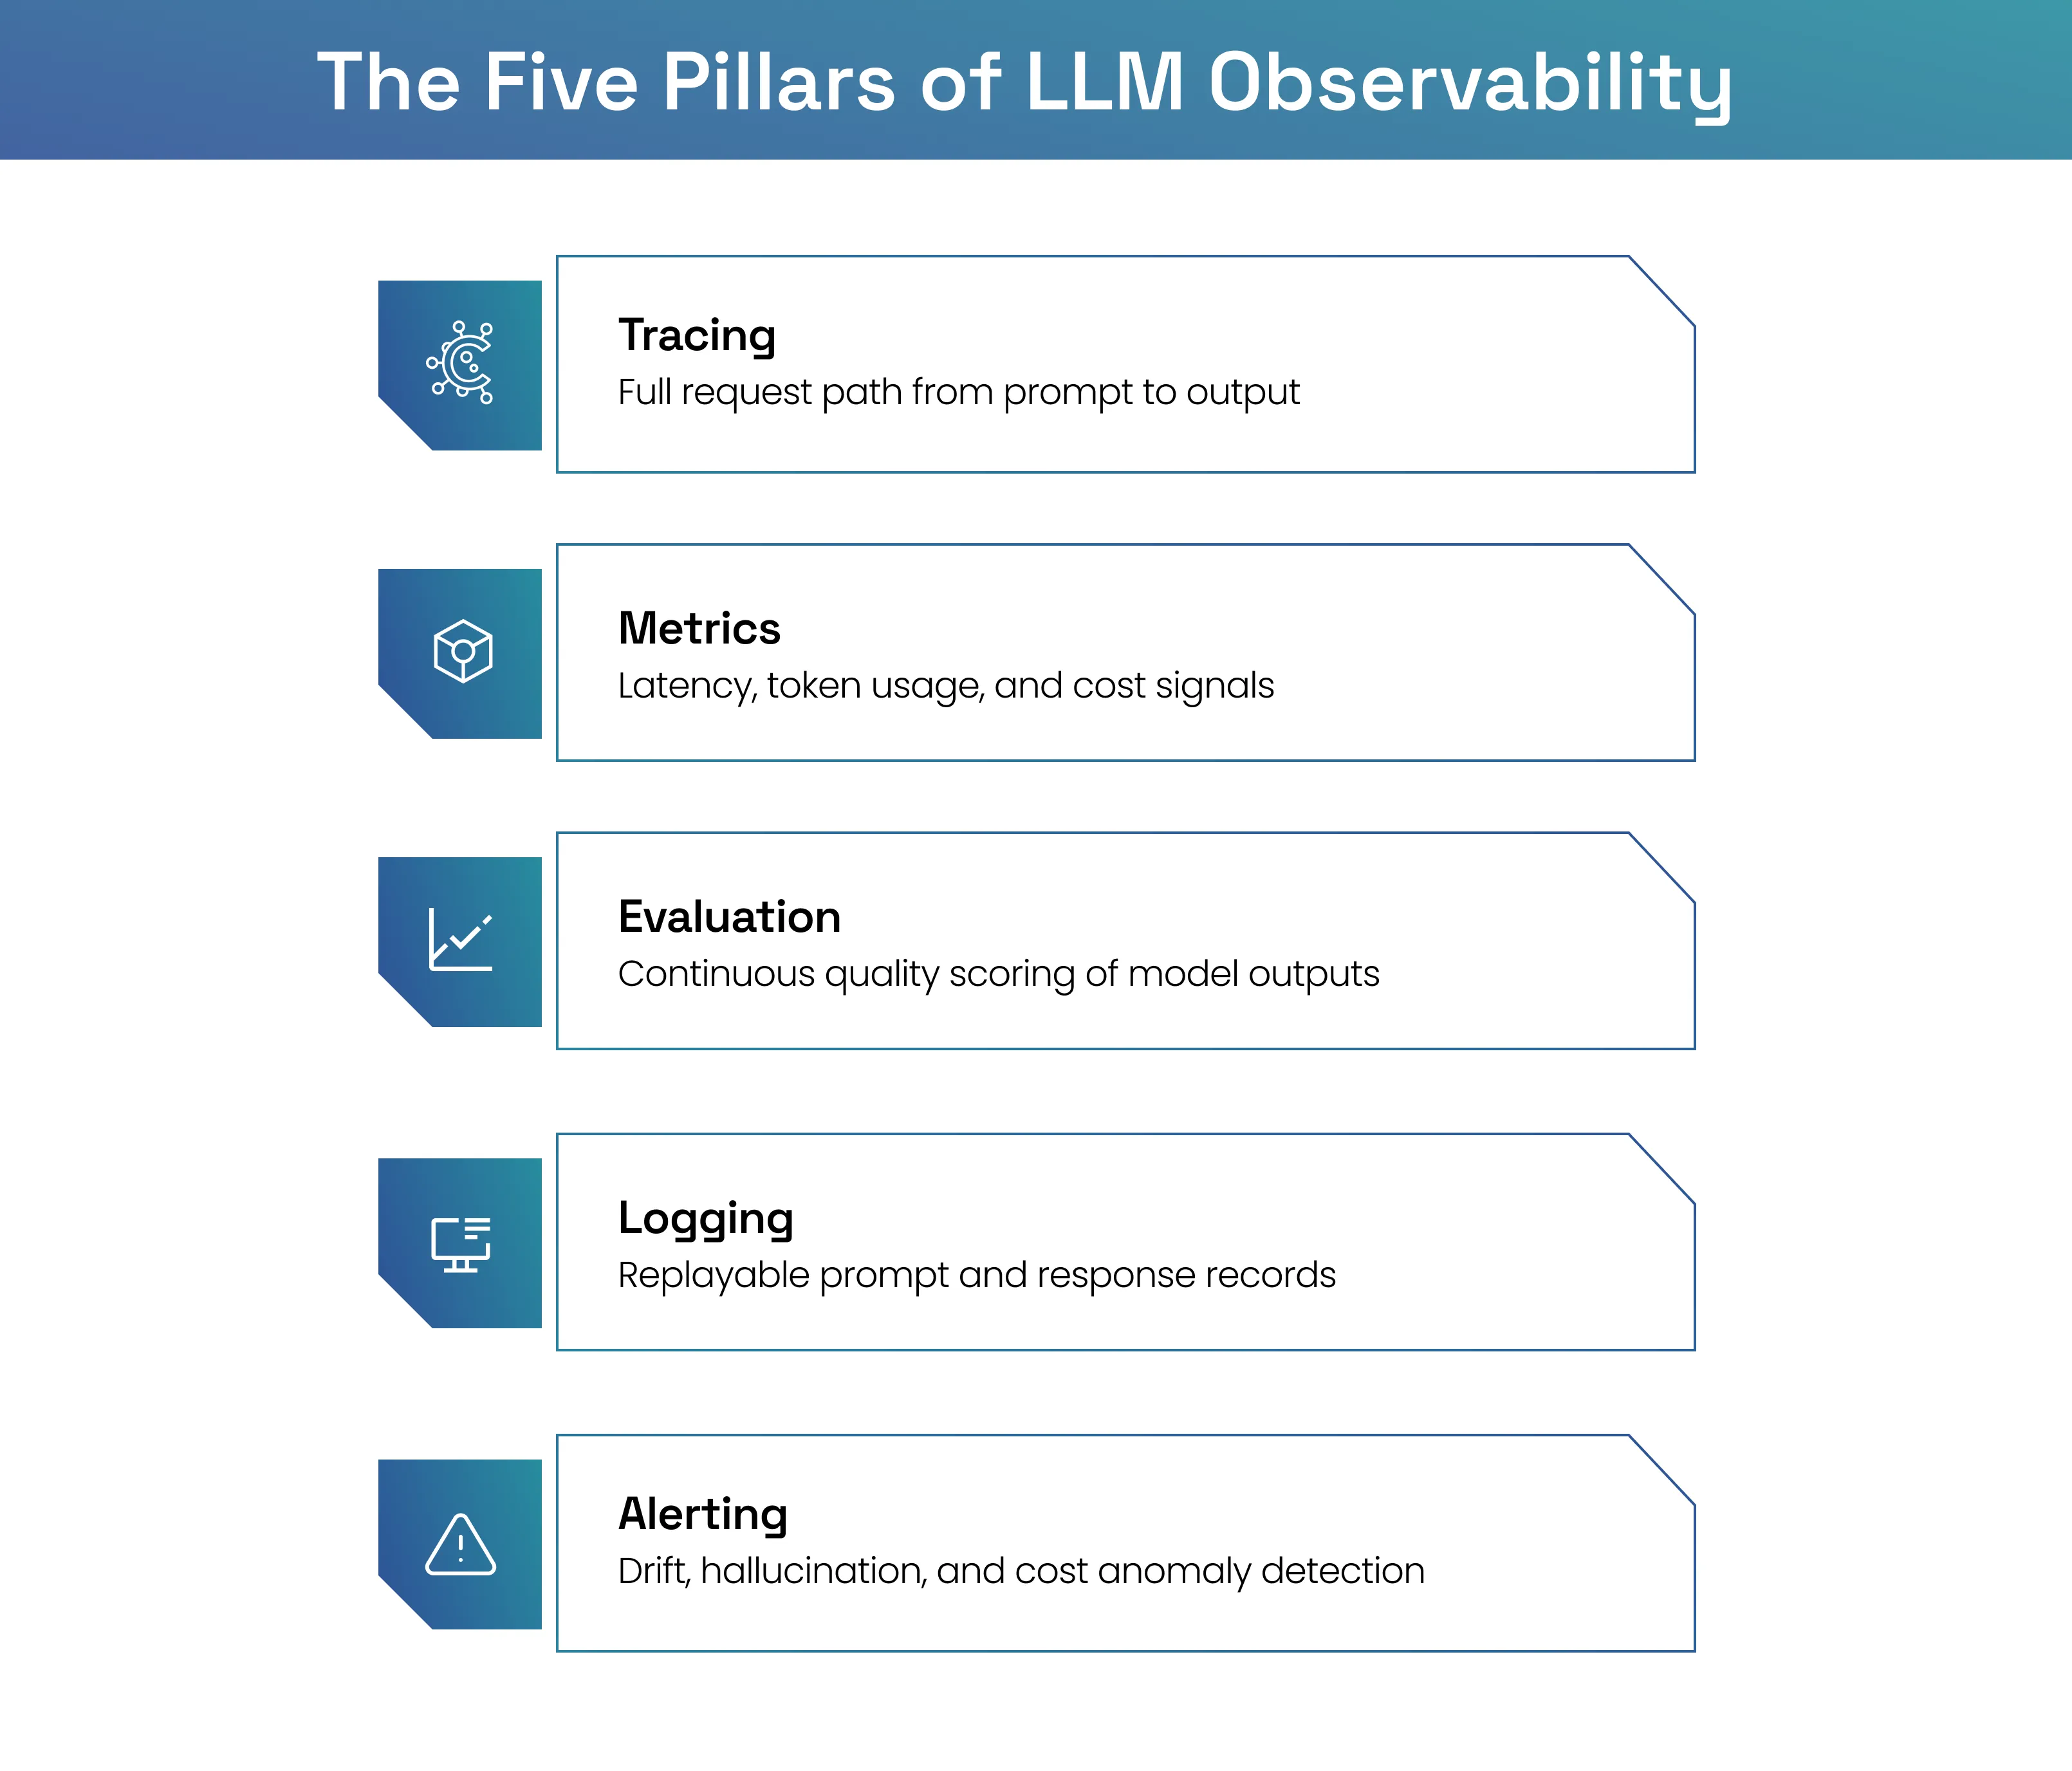
- Tracing: Captures the full request lifecycle, including every LLM call, retrieval step, and tool invocation. Each connected span records inputs, outputs, and timing so teams can replay any production failure end-to-end.
- Metrics: Tracks operational signals like latency, token usage, cost per request and time to first token. Aggregated across the production fleet, these metrics surface anomalies in response time, throughput and error rates before users notice.
- Evaluation: Scores output quality continuously using four sub-methods that work in combination across production traffic.
- LLM-as-a-judge: A separate AI model reviews selected outputs using a defined scoring system. Teams track score trends and receive alerts when quality drops. This method is cost-effective when only sampled outputs are evaluated instead of every request.
- Embedding-based scoring: This method compares how closely an AI response matches the expected answer in meaning and context. It is faster and affordable than LLM-based judging and works well for measuring answer relevance.
- Human-in-the-loop annotation: Subject experts manually review and label AI outputs through structured workflows. These reviews create reliable benchmark data that helps improve automated evaluation systems over time.
- Code-based evaluations: Automated tests check output structure, formatting, and API responses against predefined rules. These checks are fast and inexpensive but work best for outputs that can be verified objectively.
- Logging: Stores prompts, responses, retrieval contexts, model versions and metadata for replay and debugging. Logs feed audit-ready reconstruction when regulators or internal auditors request evidence on a specific decision.
- Alerting and drift detection: Flags quality regressions, performance degradation and cost spikes before they reach end users. Alerts route to incident response runbooks rather than dashboards that sit unread inside engineering tools.
Key Metrics to Track in LLM Monitoring
The metrics below are grouped into operational, quality, and safety categories, which together describe LLM performance.
Common Challenges in LLM Observability
Most enterprises face similar issues when building and scaling LLM observability across their AI systems.
- Non-deterministic outputs break standard testing: The same prompt can produce different outputs across calls or different answers between model versions. Static test cases miss most production failures that surface in live traffic.
- Multi-step agent workflows obscure root causes: A bad output may start in retrieval, prompt construction or model reasoning. Without span-level visibility, teams cannot tell which step inside the agent pipelines failed.
- Quality scoring is expensive at scale: Evaluating every production request with an LLM judge or embedding model is cost-prohibitive. Sampling strategies become a discipline of their own across evaluation metrics.
- Vendor lock-in blocks portability: Many observability solutions tie tightly to one framework or model provider. Switching infrastructure later means rebuilding the observability layer from scratch with significant engineering effort.
- Sensitive data flows through observability pipelines: Prompts and responses often carry sensitive information, including customer records and internal documents. Data privacy controls must extend into the observability layer itself.
Leading LLM Observability Tools in 2026
The platforms below represent some of the most common types of LLM observability solutions enterprises consider in 2026.
1. Solytics Partners NIMBUS Uno
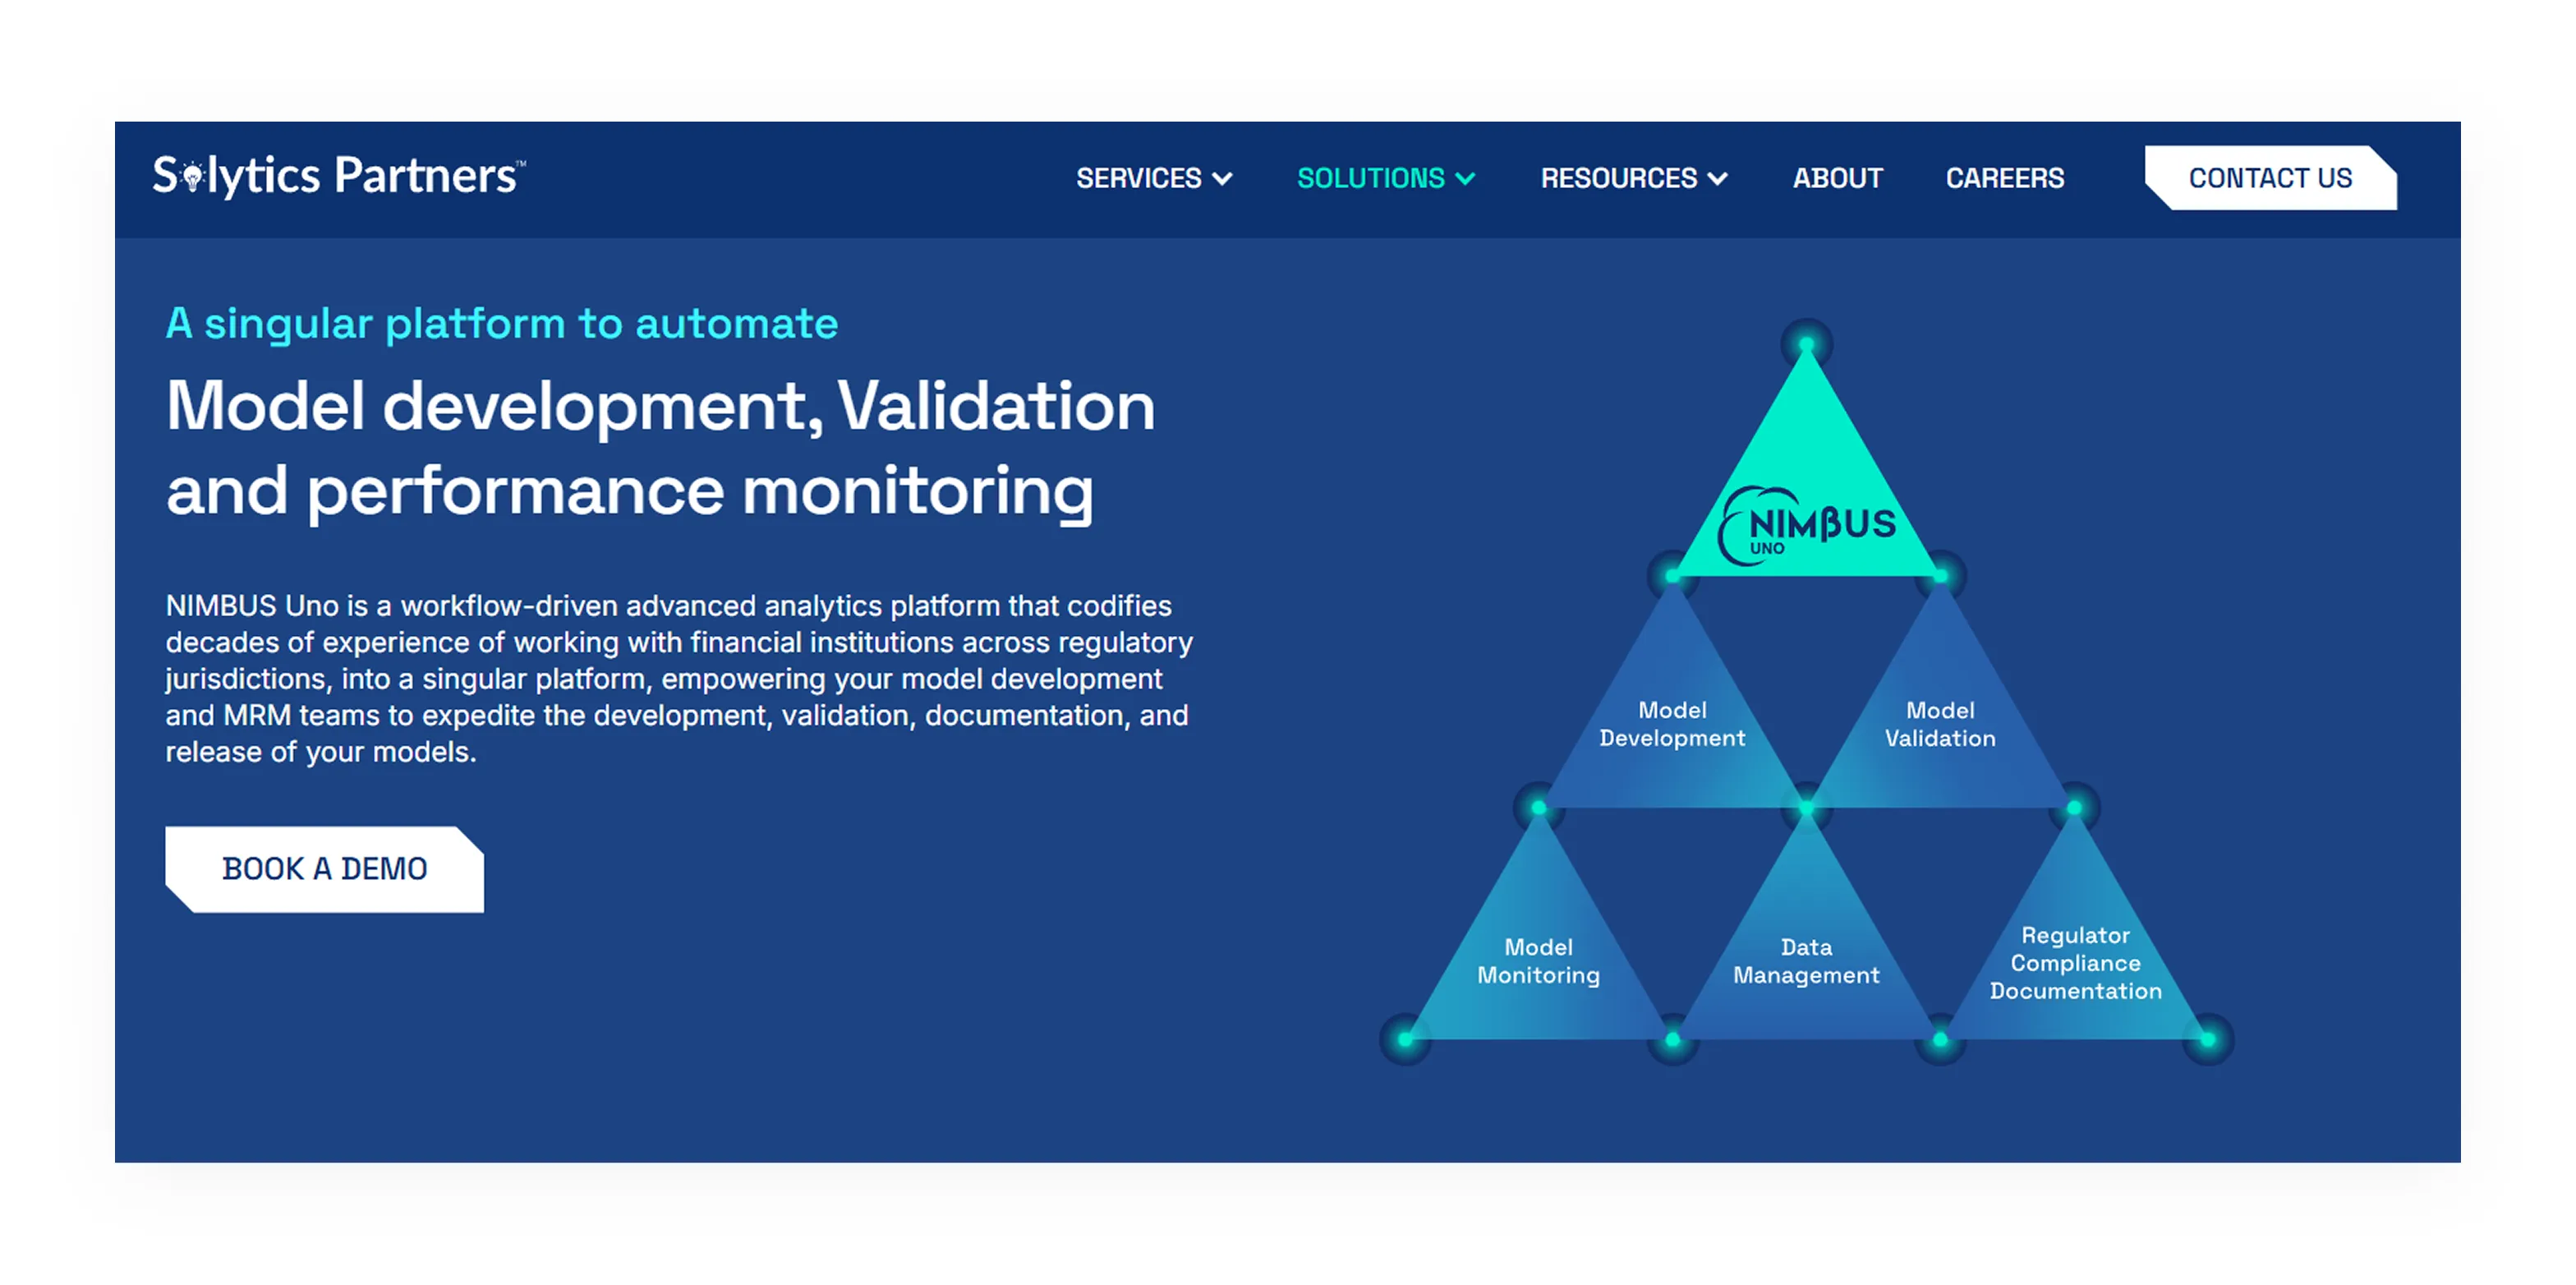
Solytics Partners NIMBUS Uno is the AI observability layer inside the broader Solytics governance ecosystem. It monitors traditional models, ML systems, generative AI, and agentic workflows continuously, capturing drift, hallucinations, prompt safety, and grounding quality. TraceIQ delivers trace-level GenAI monitoring that surfaces root causes faster than aggregate dashboards alone.
Key LLM observability features
- Native integration with OpenAI, Anthropic, Google and Meta models
- Prompt versioning and human-in-the-loop review controls
- Pre-built guardrails for safety, PHI checks and compliance
- Direct linkage to MRM Vault for audit-ready governance evidence
Pros and Cons
2. Langfuse
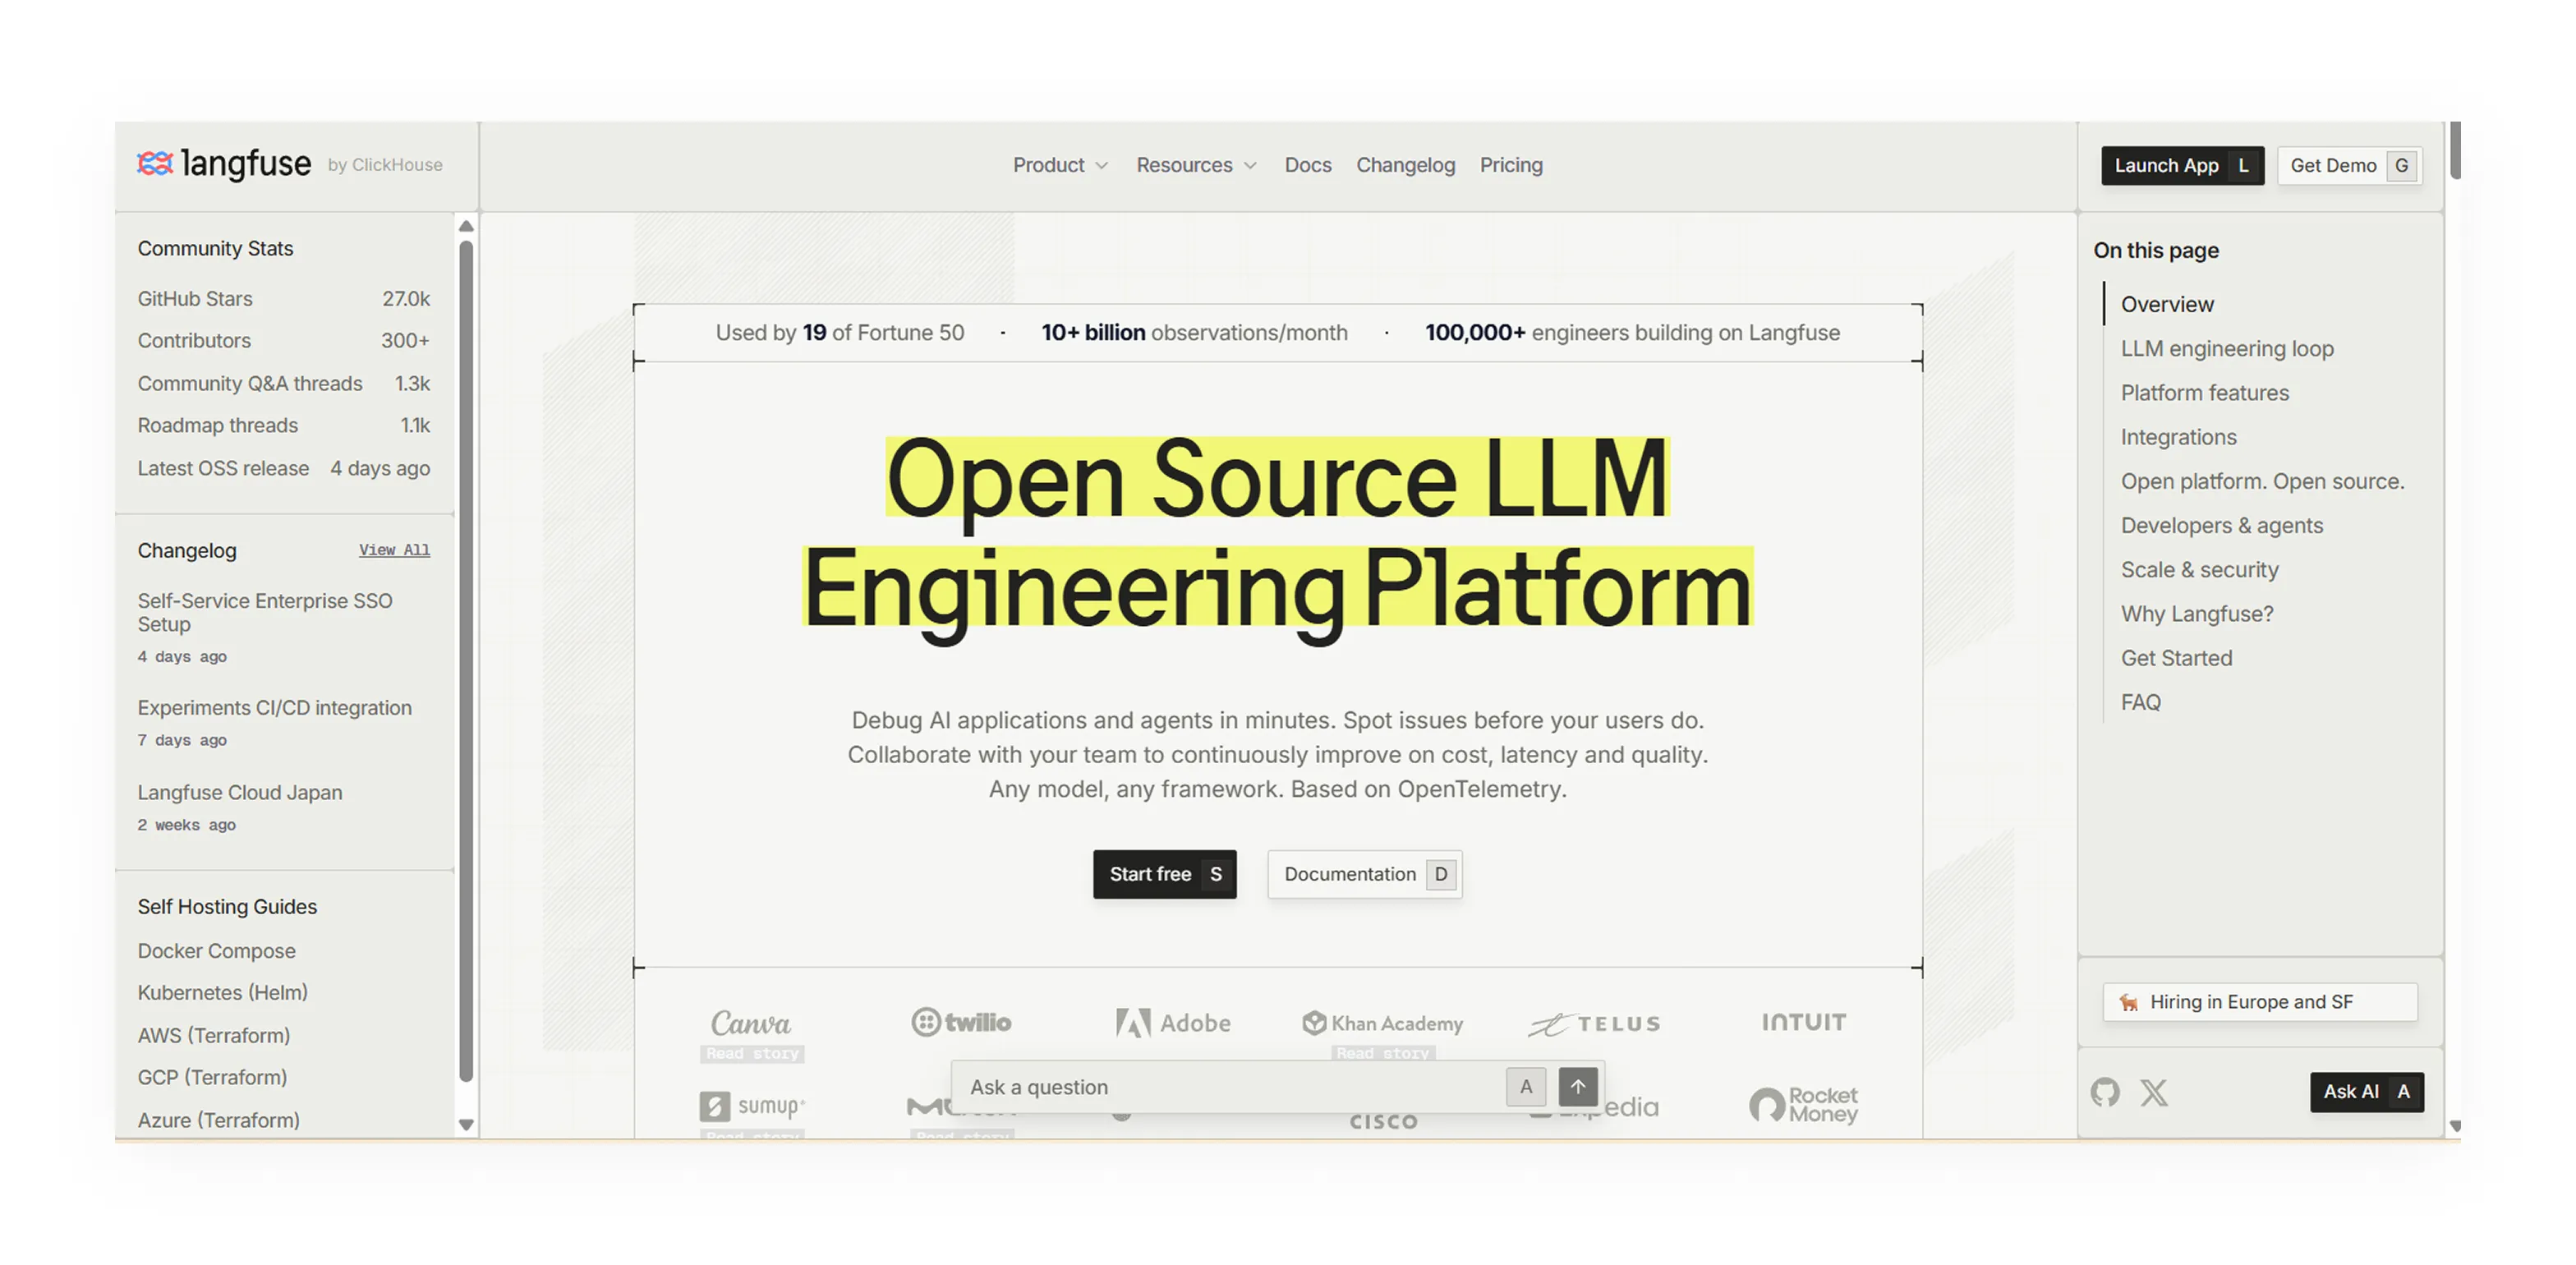
Langfuse is an open-source LLM observability platform released under the MIT license. It supports detailed tracing, prompt management and evaluation with self-hosting options that give engineering teams control over observability data.
Key features
- Detailed tracing with span-level visibility
- Prompt management and version tracking
- Self-hosting under MIT license
Pros and Cons
3. LangSmith
LangSmith is the managed observability platform from the LangChain team. It captures detailed traces for LangChain and LangGraph applications and supports annotation queues for human review of production outputs.
Key features
- High-detail traces inside LangChain and LangGraph
- Annotation queues for human review
- Tight LangChain ecosystem integration
Pros and Cons
4. Datadog LLM Observability
Datadog extends its enterprise APM platform into LLM workloads. It places LLM spans alongside infrastructure metrics, giving teams already running Datadog a single pane for application and model visibility.
Key features
- LLM spans alongside infrastructure metrics
- Inside the existing Datadog APM platform
- Enterprise SaaS deployment with support
Pros and Cons
5. Arize Phoenix
Arize Phoenix is an open-source observability tool built on OpenTelemetry standards. The notebook-first design fits ML platform teams looking to unify monitoring across traditional machine learning and LLM workloads.
Key features
- Notebook-first observability workflow
- OpenTelemetry-aligned instrumentation
- Unified monitoring across ML and LLM
Pros and Cons
6. Helicone
Helicone is an API gateway with request-level observability. It sits between an application and LLM providers, adding cost tracking, caching and routing with minimal code changes required from engineering teams.
Key features
- Proxy gateway between application and LLM
- Cost tracking and request caching
- Routing across multiple LLM providers
Pros and Cons

How to Implement LLM Observability?
Enterprises usually use four common approaches to set up LLM observability, depending on the level of visibility they need and the implementation effort involved.
1. Proxy-Based Observability
Change the LLM provider URL to an observability proxy like Helicone or Portkey. The proxy captures every request before sending it to the AI model provider.
Best for: Fast deployment in serverless environments where engineering bandwidth is limited.
2. SDK Instrumentation
Add SDK-based wrappers or callbacks from tools like Langfuse or LangSmith. These automatically track and record details for every model interaction.
Best for: Teams with deep visibility needs across custom workflows and chained agent operations.
3. Environment Variable Configuration
Turn on observability using configuration settings instead of changing application code. Tools like LangSmith and LangChain can automatically detect runtime variables and monitor activity.
Best for: Single-framework stacks where the application already uses one orchestration library.
4. OpenTelemetry Standards
Use vendor-neutral observability tools like OpenLLMetry or Traceloop. These tools send monitoring data to platforms such as Datadog, Grafana, New Relic, or Splunk using OpenTelemetry standards.
Best for: Teams with existing APM infrastructure that already standardizes on OpenTelemetry.
How to Build an LLM Observability Practice
Use these five steps to operationalize effective observability across production LLM applications.
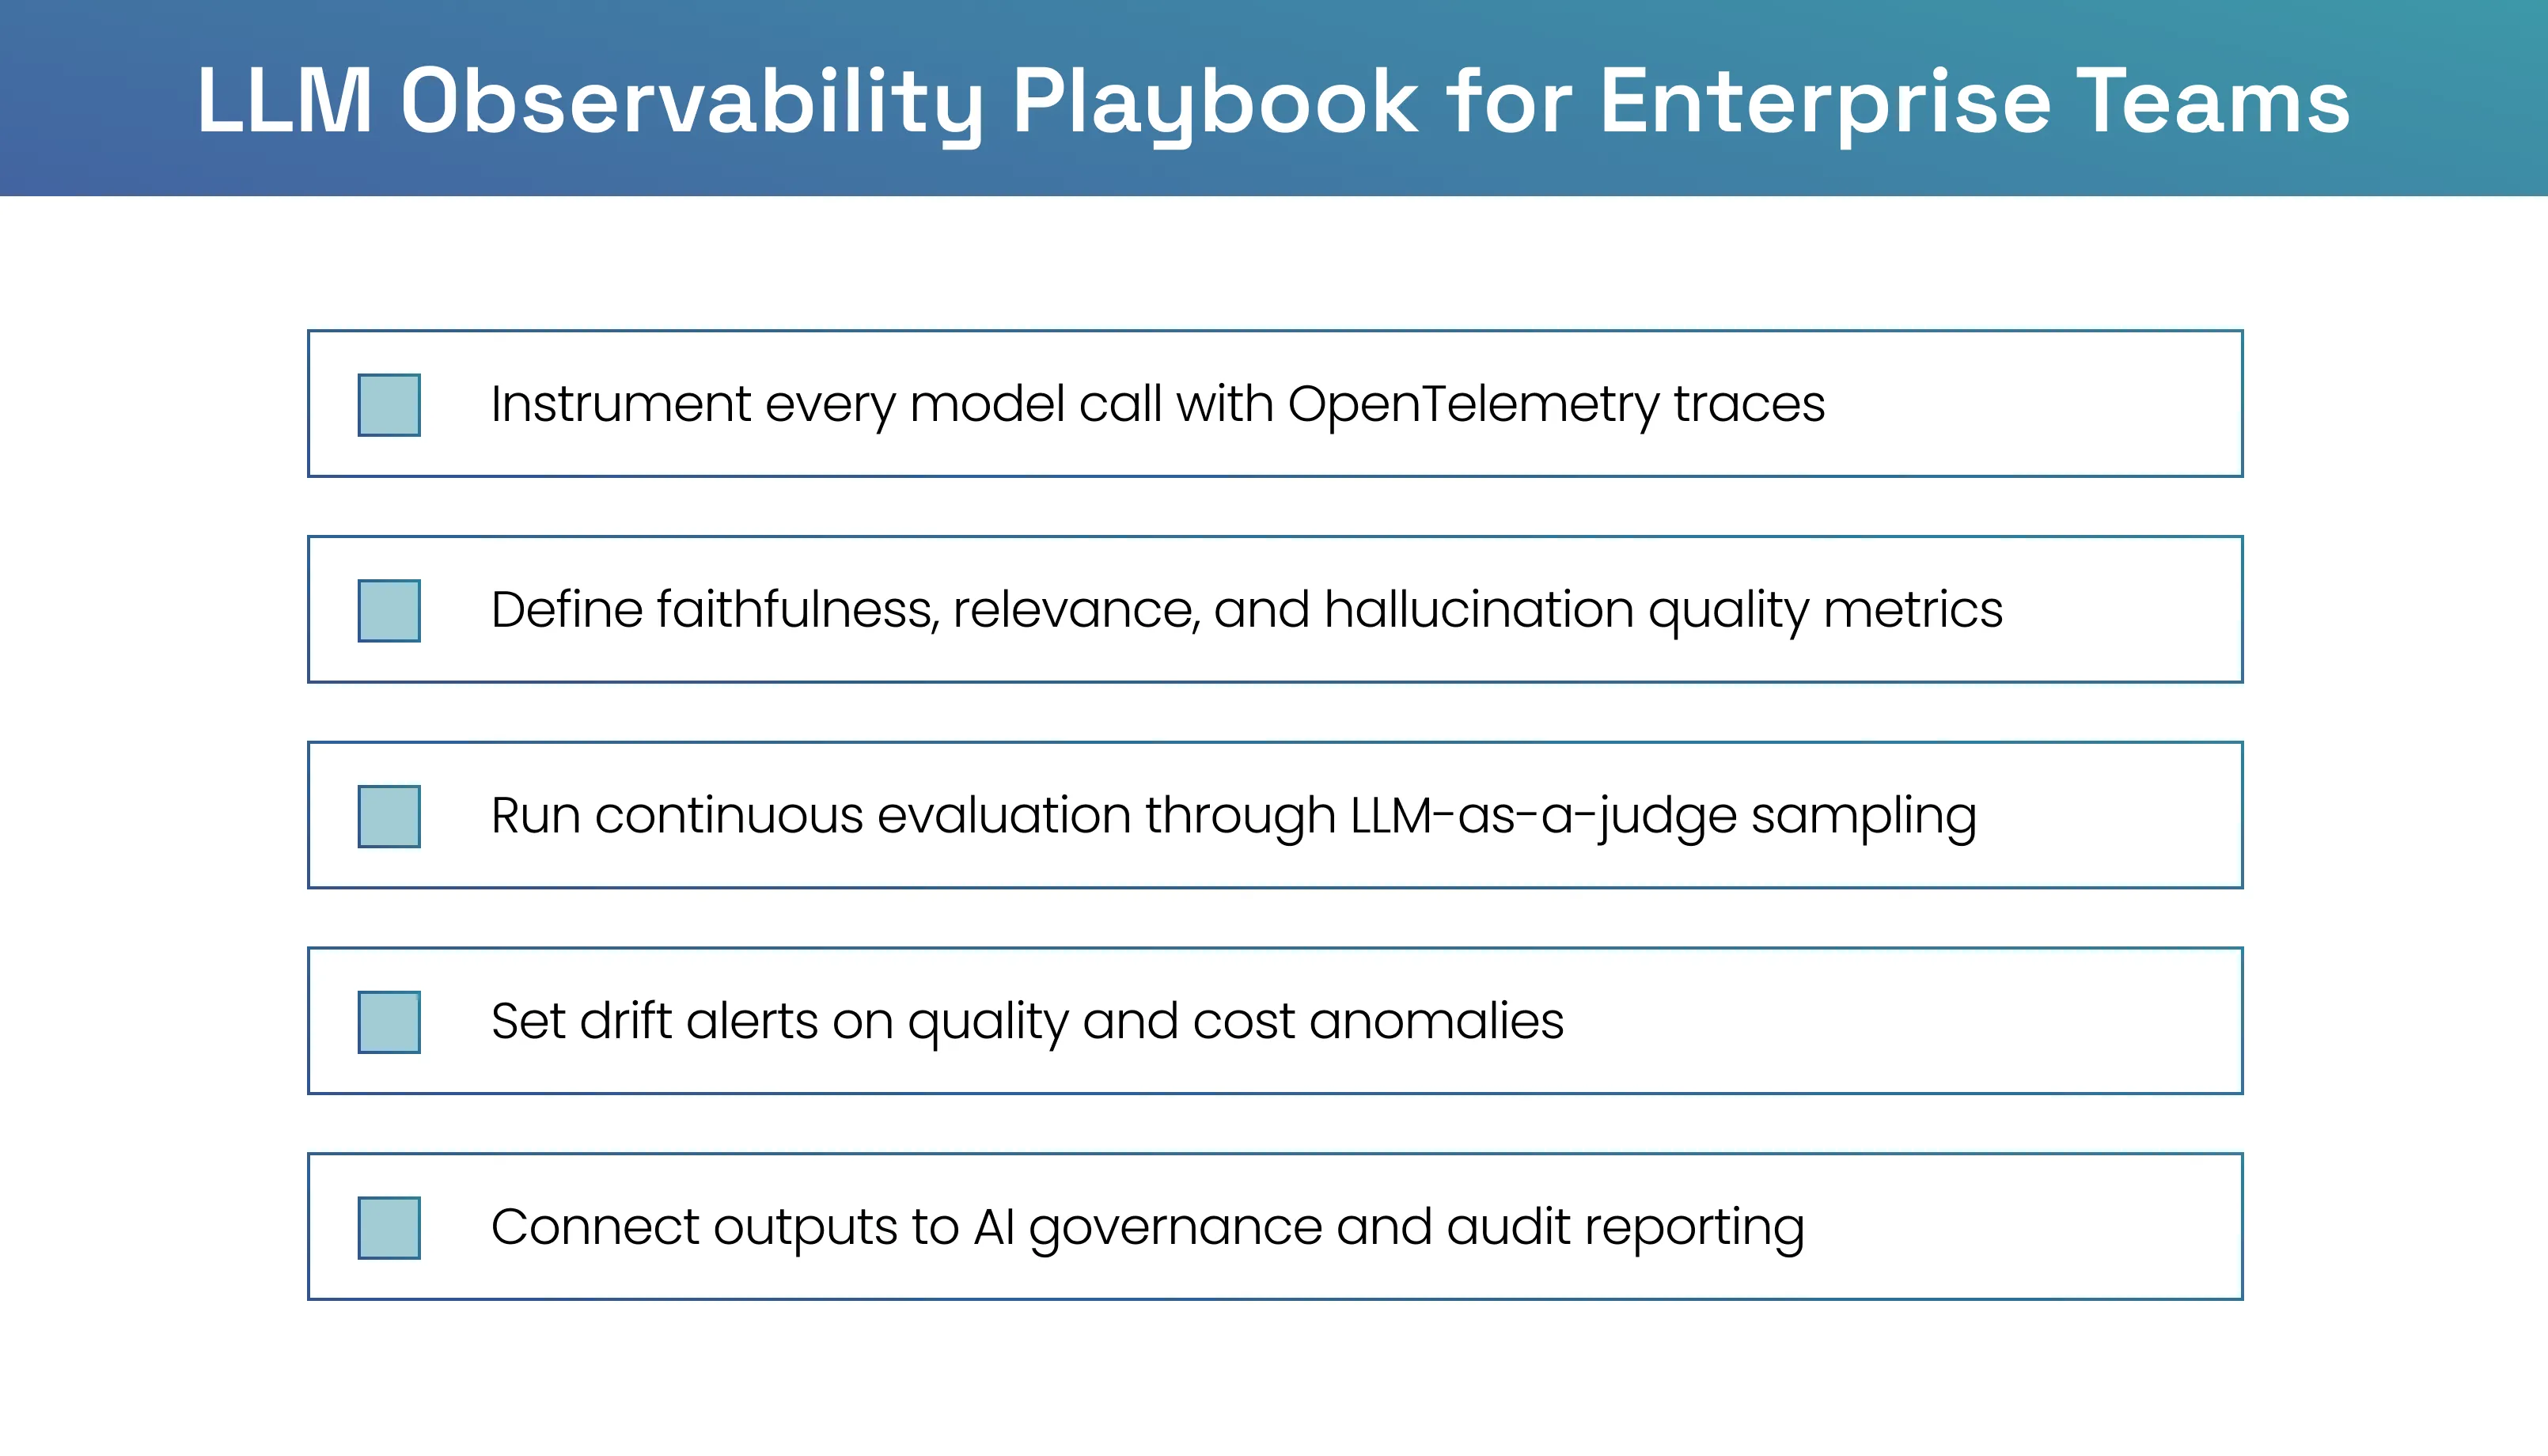
- Track every model request, retrieval step, and tool action using trace-based monitoring standards like OpenTelemetry.
- Define clear quality metrics based on your use case, such as relevance, accuracy, hallucination detection, and safety.
- Continuously evaluate model performance using sampled AI reviews instead of relying only on manual offline testing.
- Set alerts for quality drops, unusual costs, and sudden changes in user inputs or model behavior.
- Connect observability tools with your AI governance platform to automatically generate audit logs and incident reports.
Final Remarks
LLM observability has become a business requirement across regulated industries an is no longer only a developer tool. Issues like hallucinations, rising token costs, and unnoticed quality drops are now treated as serious operational risks. Leadership teams expect continuous monitoring and clear visibility into how AI systems perform in production.
Organizations leading in AI adoption use observability to connect model development, production monitoring, and compliance reporting. They create continuous feedback loops that help improve prompts, models, and user experience over time while resolving issues faster at scale.
Solytics Partners NIMBUS Uno delivers that foundation with trace-level GenAI monitoring through TraceIQ, real-time guardrails for safety and PHI, native LLM provider integration and direct linkage to MRM Vault for audit-ready governance reporting.
Book a 1:1 demo and see how observability fits into a unified AI control plane.
Frequently Asked Questions
Can LLM observability tools detect prompt injection attacks in real time?
Yes, modern observability tools detect prompt injection through pattern matching and classifier models inside the request path. Detection rates improve when paired with adversarial test datasets. Real-time blocking requires pairing observability with runtime guardrails rather than monitoring alone.
What is the role of OpenTelemetry in LLM observability?
OpenTelemetry provides a vendor-neutral standard for emitting traces, metrics and logs from LLM applications. It lets teams send telemetry to any compatible backend without rewriting instrumentation code. Adoption keeps observability portable across changing infrastructure and tooling choices.
How do enterprises measure ROI from an LLM observability investment?
Measure ROI through reduced incident resolution time, lower token cost per workflow and avoided compliance penalties. Track production incidents avoided through early drift detection. Compare audit preparation hours before and after deploying observability across the LLM portfolio.
Should LLM observability be self-hosted or delivered through a SaaS platform?
The choice depends on data sensitivity and engineering capacity inside the organization. Self-hosted options like Langfuse work for teams with strict data privacy rules. SaaS platforms reduce operational burden but require careful data residency review during procurement.
What is LLM observability in production?
LLM observability in production means continuous capture and analysis of every model call, prompt, response and tool invocation that runs in live systems. It produces evidence of quality, cost and safety on demand. Observability replaces point-in-time testing with continuous measurement.
How is LLM observability different from traditional monitoring?
Traditional monitoring tracks deterministic systems with predictable inputs and outputs. LLM observability handles non-deterministic outputs, semantic quality scoring and prompt-driven failure modes that legacy tools miss. It focuses on response quality alongside infrastructure signals.
.webp)
.svg)


