We have been recognized in RegTech100 2026 - Strengthening leadership across AI governance, MRM and FCC


.webp)
Right now, your GenAI system is producing outputs your logs are not capturing. Some of those outputs are hallucinated. Some may be non-compliant. A few might have already reached customers. You will not find them by checking your dashboards, because there is a gap in your visibility.
That gap is not a monitoring problem. It is an observability problem, and it is the starting point for everything this blog covers.
GenAI observability is the ability to monitor, understand, and troubleshoot generative AI models across their entire lifecycle, from the moment a user submits a prompt to the moment a large language model delivers a response.
It is the foundation on which everything else is built: continuous monitoring, evaluation, governance, and ultimately, the ability to trust what your artificial intelligence systems are doing in production.
In this blog post, we cover what GenAI observability actually captures, why standard monitoring tools fall short, what to instrument at each layer of the pipeline, and how to connect it all to governance and regulatory compliance.
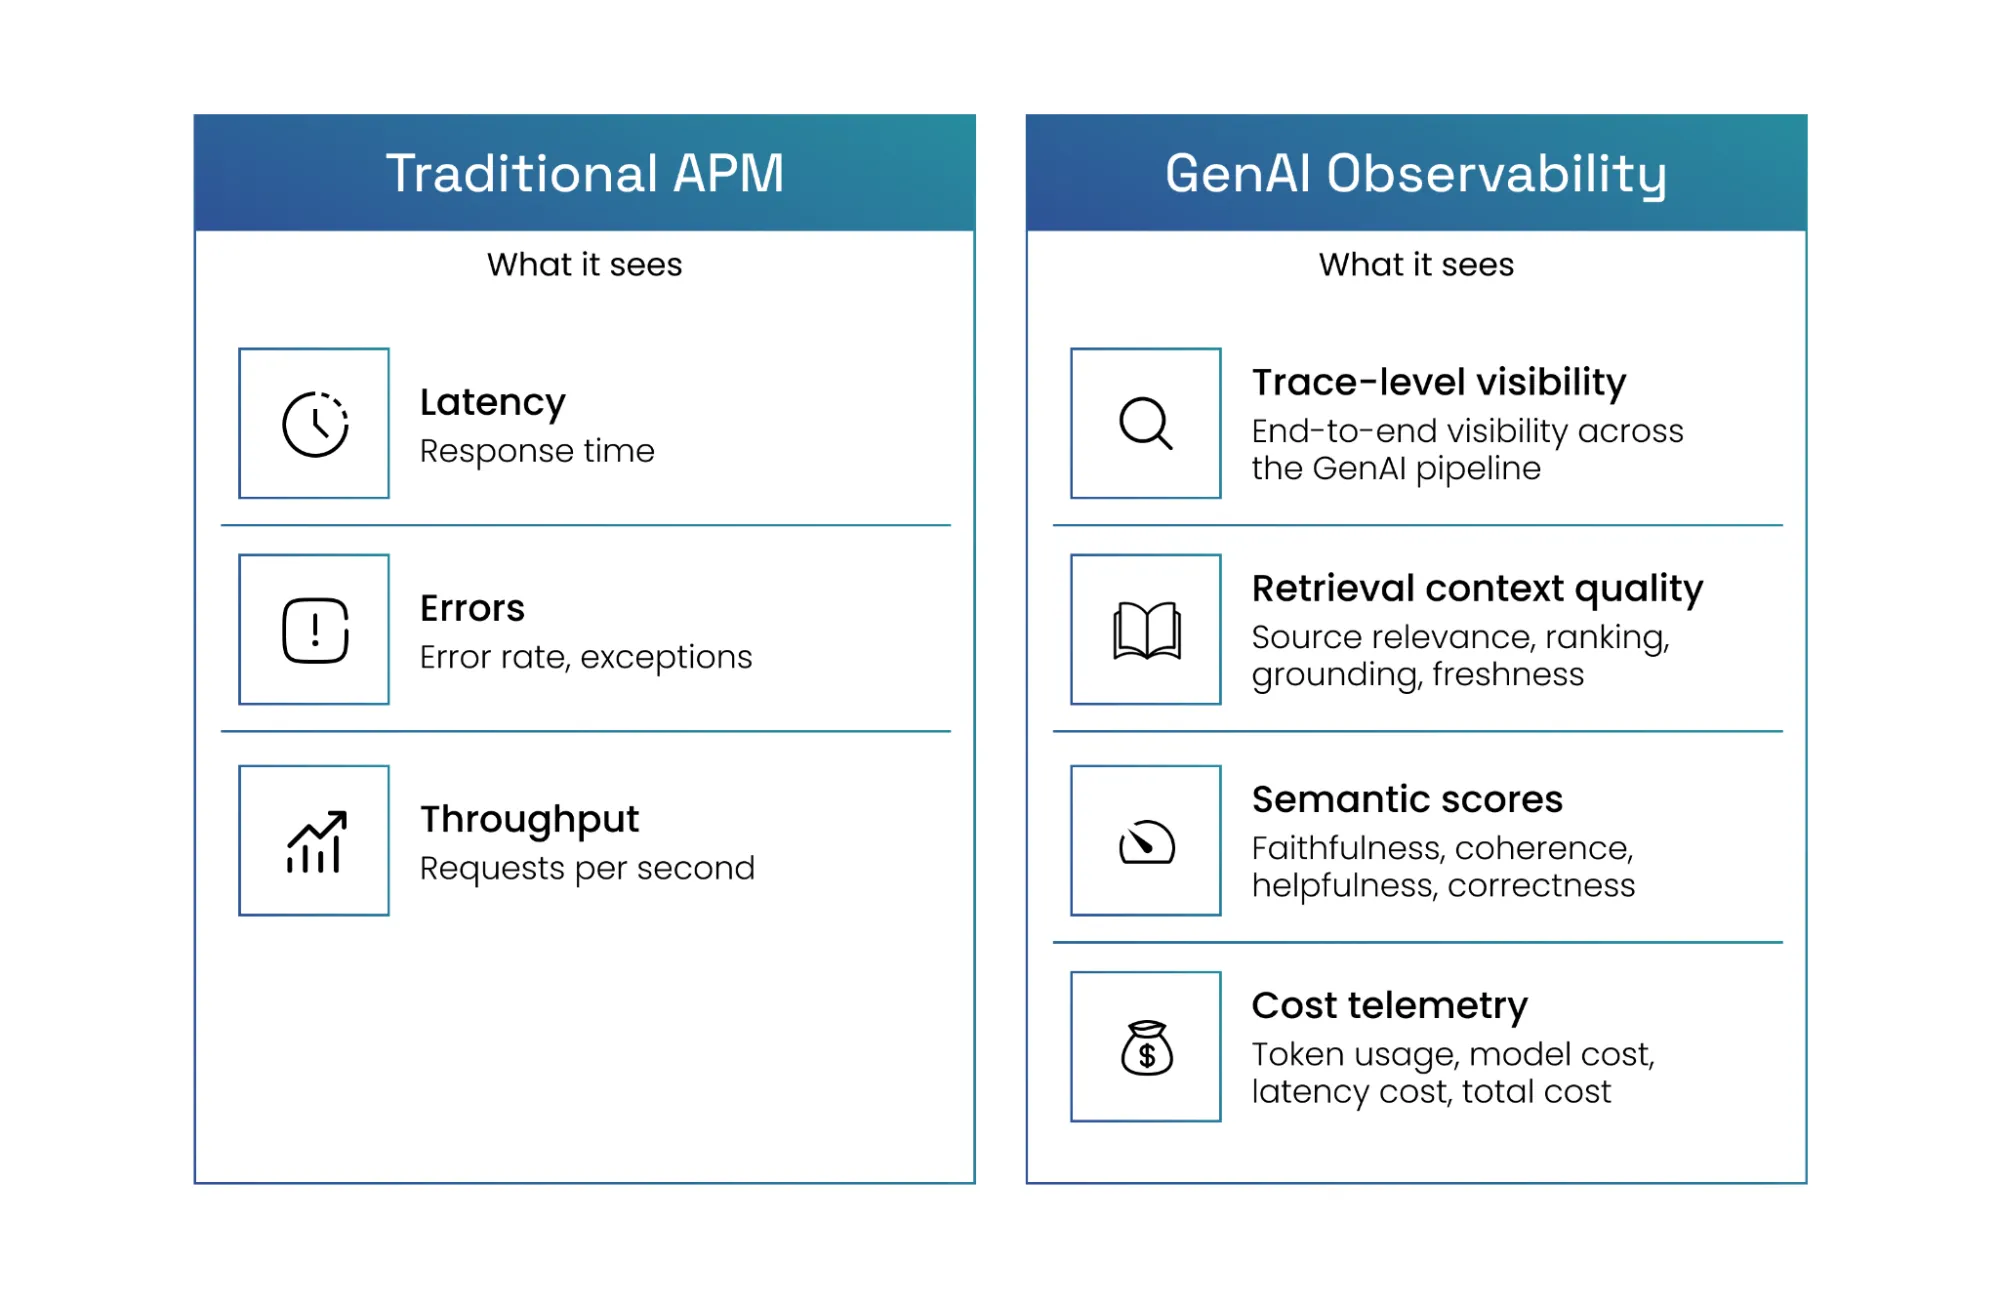
Why Can't Standard APM Tools Handle GenAI?
Your existing stack was built for predictable software: a request comes in, logic executes, a response goes out. Traditional observability tools are excellent at catching those kinds of problems, but GenAI systems do not behave that way.
The Determinism Gap
Traditional monitoring assumes that a successful response is a correct response. However, a GenAI system can return a fluent, confident, but entirely hallucinated answer that registers as a 200 OK. Because standard APM cannot evaluate meaning or intent, an error rate of zero provides no insight into the actual accuracy of the system.
The Context Gap
When a GenAI service experiences latency, standard tools can identify where performance issues occur but not why. A service might be slow because a vector database retrieval returned an excessive amount of irrelevant noise, forcing the model to process a bloated context window. Without visibility into the retrieval pipeline, performance investigations remain speculative.
The Quality Gap
Infrastructure metrics confirm a system is running, not that it is compliant. Whether a response is factually grounded, toxic, or leaking PII is invisible to a standard monitoring stack. Bridging this gap requires an AI observability platform that works alongside GenAI guardrails to score outputs against the retrieved context, enforce policy controls, and detect unsafe behaviour rather than relying only on application telemetry.
What GenAI Observability Actually Does
A mature GenAI observability platform helps teams:
- trace multi-step AI pipelines
- detect hallucinations and drift
- monitor token usage and cost
- evaluate output quality continuously
- produce governance-ready audit trails
Without observability, organisations cannot reliably explain why their AI systems behave the way they do.
What Should You Measure in GenAI?
Before thinking about how to observe a GenAI system, it helps to be clear on what actually needs to be measured. The key metrics fall into four categories, each answering a different question about system health.
What are GenAI Operational Metrics?
Operational metrics tell you whether the system is performing within acceptable parameters at the infrastructure level. For production teams, two latency metrics matter most:
- Time to First Token (TTFT): The latency users actually feel as they wait for a response to begin appearing.
- Total generation time: The full request completion time from prompt to final output.
TTFT Is the UX Metric That Matters Most
Users tolerate long responses far better than delayed responses. Time to First Token often has a greater impact on perceived quality than total generation time.
The gap between the two often reveals where the real bottleneck lies. Beyond latency, the following performance metrics round out the operational picture:
- Throughput: Performance data across requests per second and tokens per second under normal and peak load
- Error rates: Request failures and timeout rates.
- Load patterns: Volume spikes and abnormal drops that may indicate upstream issues or unusual usage behaviour.
What are AI-Specific Metrics?
Traditional software monitoring tells you whether a system is running. AI model monitoring goes further by measuring whether generative AI systems are working as intended. This distinction matters most in production, where a system can be technically healthy by every infrastructure measure while quietly producing outputs that are wrong, unsafe, or expensive.
How Does Model Drift Differ From Data Drift?
Performance degradation in generative systems is rarely static. It is essential to distinguish between Model Drift (degradation in response quality and alignment) and Data Drift (shifts in the distribution of user queries).
Effective drift detection requires automated alerts when accuracy decreases for specific use cases, along with the ability to distinguish between the two types so that remediation is targeted correctly.
How Do You Track GenAI Costs?
Cost visibility in GenAI is more granular than in traditional software because the cost driver, token consumption, varies at the level of individual requests.
- Cost per user: Token consumption by individual user or role, useful for identifying heavy users and designing fair usage policies.
- Cost per application: Token spend by feature or component, enabling prioritisation of optimisation efforts.
- Cost per model version: Comparative analysis across iterations to understand whether an upgrade is delivering value for its cost.
- Zombie agent detection: Real-time monitoring for agents stuck in reasoning loops, which can burn thousands of tokens in minutes with no alert firing and no one noticing until the invoice arrives.
Zombie agents are the silent budget killers of enterprise GenAI. Real-time token monitoring is not a nice-to-have; it is a financial control.
Knowing what to measure is foundational, but the metrics only make sense when they are tied to the specific components generating them. A GenAI system is not a single unit; it is a pipeline, and each stage of that pipeline has its own failure modes that require dedicated instrumentation.
What GenAI Components Need Observability?
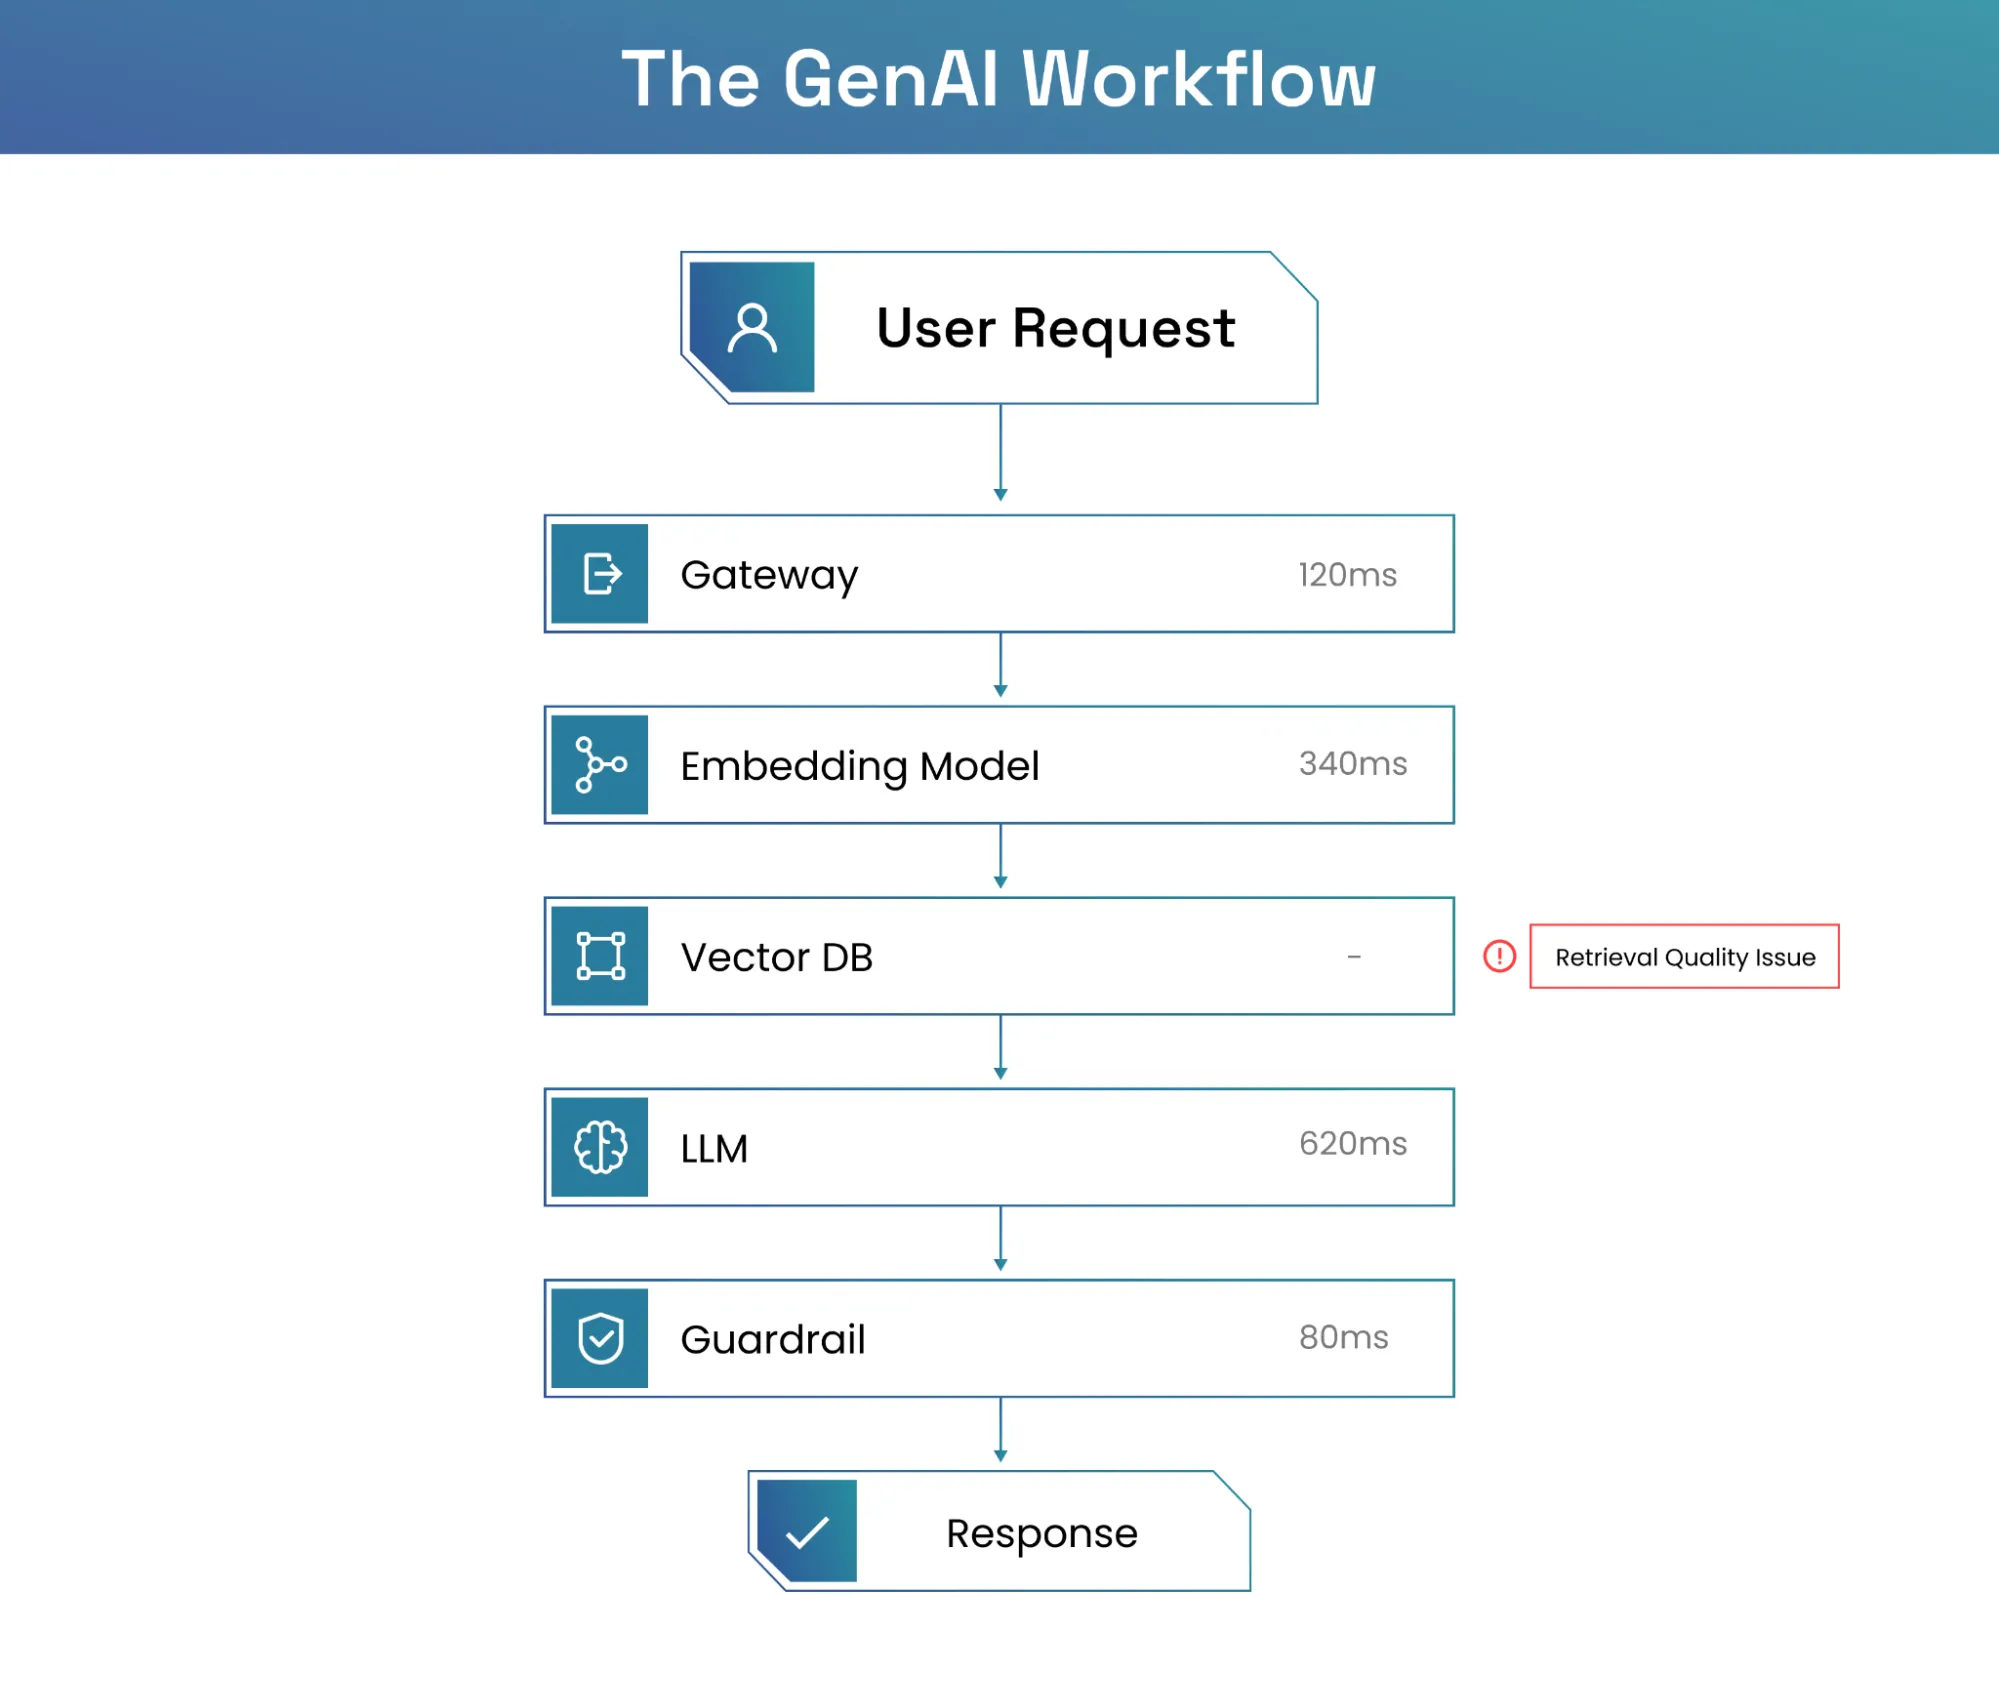
A production GenAI system is a distributed pipeline, not a single model call. Failure modes at one tier routinely masquerade as problems at another.
A retrieval failure looks like a hallucination. An orchestration loop looks like a latency spike. An infrastructure bottleneck looks like a model quality issue.
Without instrumentation at every layer, root cause analysis is guesswork.
Retrieval-Augmented Generation and Vector Tiers
The retrieval layer is the most common source of quality degradation in RAG systems, and the problems here are rarely obvious.
What to instrument
Document relevance scoring, context window utilisation, embedding generation latency, and chunk selection quality.
For semantic cache systems
Monitor hit and miss ratios and staleness metrics. Shifts in vector similarity score distributions are often the earliest warning of semantic drift, where user query patterns begin to diverge from what the knowledge base was built to answer.
Orchestration and Agentic Logic
Orchestration frameworks such as LangChain or LangGraph introduce complex execution paths requiring full span-level tracing. For multi-step workflows, the complete decision tree must be captured:
- Tool invocation success: Reliability and latency of external API calls or function executions.
- Agent decision paths: Reasoning steps taken, to identify excessive complexity or loops.
- Task completion metrics: Delta between the agent's intended goal and the final output state.
- Loop detection: Identifies and terminates agents in infinite recursive cycles before token costs spiral.
Provider and Infrastructure Telemetry
In multi-provider environments, performance must be benchmarked across endpoints rather than assumed to be consistent. Provider-specific rate limits, fallback activation rates, regional availability patterns, and version uptime all need to be tracked. Relying on a single provider without visibility into these signals is an unmitigated operational risk that tends to surface at the worst possible moment.
The Infrastructure Stack
Infrastructure signals sit at the base of the observability stack and provide the context needed to interpret everything above them.
With instrumentation requirements defined at each architectural tier, the next layer of the framework addresses how those signals are collected, structured, and made actionable.
The Five Pillars of GenAI Observability
A production-grade observability framework must deliver five key components to ensure system reliability, cost-efficiency, and regulatory compliance
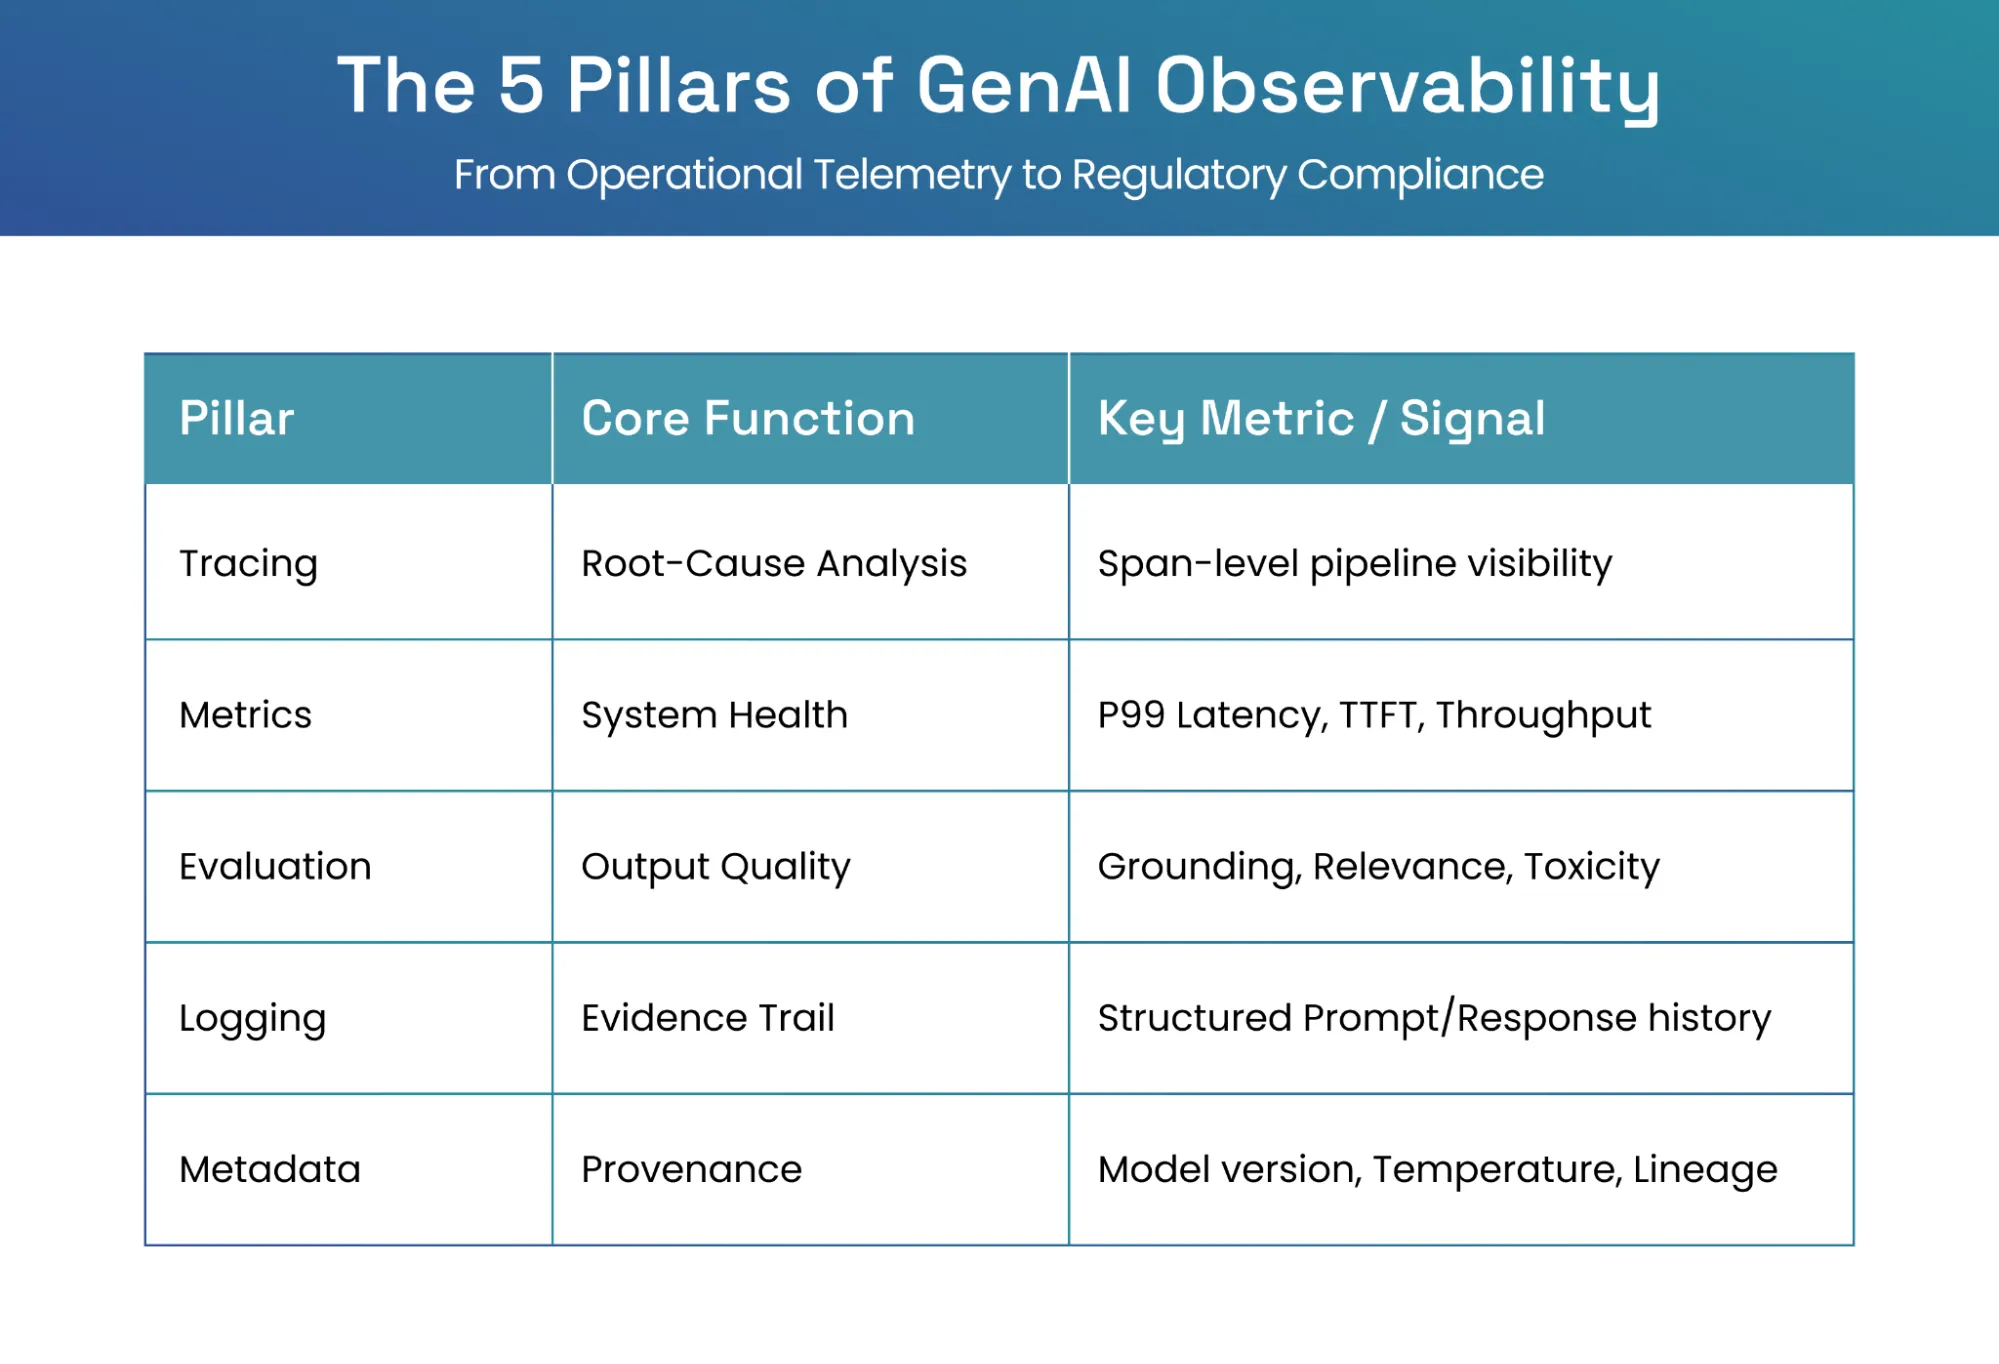
01. Pillar 1: Tracing — the "How"
Tracing is the only observability signal that makes root cause analysis possible in a multi-step GenAI pipeline. Without it, debugging starts at the output and works backward through guesswork.
How it works:
Every GenAI request is tracked as a parent trace, broken into individual spans at each stage of the pipeline:
Prompt construction → Vector retrieval → Tool invocations → Agent decisions → Model inference.
Each span records its own timing, inputs, and outputs. When a response is wrong, the trace tells you exactly which span produced the problem and what data flowed through it.
Trace-and-span architecture:
The parent trace represents the full request lifecycle. Child spans nest within it, one per pipeline stage. This structure makes it possible to see both the end-to-end picture and the detail of any individual step without switching between tools or reconstructing events manually.
Root cause analysis in complex workflows:
In agentic systems where a single user request may trigger dozens of tool calls, retrieval steps, and model invocations, traces are the only way to follow the execution path reliably. A latency spike at step eight of a twelve-step workflow, or a tool invocation failure that silently degraded the final response: neither is visible without span-level tracing across the full pipeline.
02. Pillar 2: Metrics — the "What"
Metrics are the aggregated, time-series signals that monitoring dashboards are built on. Individual metrics tell part of the story; combinations tell you whether a system is healthy, degrading, or approaching a threshold.
Why each metric category matters:
Operational metrics (latency, throughput, error rates) tell you whether the system is available and within performance SLAs. AI-specific metrics (hallucination rate, grounding score, guardrail violations) tell you whether the system is behaving correctly. Cost metrics (token consumption, cost per request) tell you whether it is economically sustainable. Drift metrics tell you whether any of the above are changing in ways that require intervention.
How to interpret metric combinations:
Individual metrics can mislead. A grounding score of 0.9 looks healthy until you see that retrieval recall has dropped by 40%. The combination tells the real story.
Alerting thresholds by category:
Set thresholds at the combination level wherever possible. Single-metric alerts generate noise. A useful starting framework:
- Operational: Alert on P95 latency breach, error rate above 1%, or throughput drop exceeding 20% from baseline
- AI-specific: Alert when hallucination rate exceeds the pre-production benchmark by a defined margin, or when grounding score drops below the validated threshold
- Cost: Alert on cost-per-request increases above a rolling average, and on any single-session token spike indicative of a reasoning loop
- Drift: Alert when PSI or distribution shift scores cross significance thresholds, triggering a validation review rather than an immediate rollback
03. Pillar 3: Evaluation — the "Quality"
Evaluation is what separates observability from mere logging. Traces and metrics tell you what happened. Evaluation tells you whether it was good.
LLM-as-a-judge
A separate, trusted model scores production outputs at scale for coherence, factual grounding, safety, and relevance, making quality assessment continuous rather than periodic.
A judge that scores outputs without visibility into its own reasoning is not an audit trail. It is a second opinion with no accountability. Observability must extend to the evaluator, not just the system being evaluated.
PromptEval Lab makes the evaluation process as transparent and auditable as the production system it is evaluating. Every run is traceable. Every scoring decision is explainable.
Human-in-the-loop validation
Automated scoring handles scale. Human review handles ambiguity. Human ratings also serve as calibration data that keeps the judge model accurate over time.
04. Pillar 4: Logs — the "Evidence Trail"
Logs are the permanent record of what your GenAI system did, when it did it, and why. A well-designed logging layer serves two masters: the engineer debugging a production incident and the auditor reviewing a regulatory submission.
What every log entry should capture
Prompt and response pair, token counts, latency, retrieval results, model version, and evaluation scores. Enough context to reconstruct any interaction without relying on memory.
Where logs become truly valuable
Not at the request level, but at the aggregate. Patterns invisible in a single log become obvious across thousands: a prompt template quietly underperforming, a retrieval index degrading week over week, a user cohort consistently hitting guardrail violations.
Two decisions that get deferred until they cause problems:
- Privacy: prompt and response logs may contain sensitive user data. Redaction, access controls, and retention policies need to be in place before the first log is written, not after the first audit.
- Searchability: structured formats make it possible to query by prompt version, model version, or session ID. In a live incident, that is the difference between a fifteen-minute investigation and a three-hour one.
05. Pillar 5: Metadata and Lineage — the "Provenance"
“Given this output, what was the exact state of the system that produced it?”
That is the question regulators ask most often. Metadata and lineage together make it answerable.
Metadata captures the full configuration at the time of each request: model version, temperature, maximum token limit, and the active system prompt version.
Lineage tracks the data flow from retrieval through to response, connecting every output to the source documents that informed it.
A complete provenance layer goes further, covering the full history of how the system evolved and how it is being used:
- Version history of every prompt and configuration change, timestamped and authored
- A/B test outcomes and model comparison results, preserved alongside the configs that produced them
- User session metadata reveals usage patterns across interactions that surface how the system is actually being used in practice
The five pillars define what a mature observability framework looks like. But observability is not something you activate at a single point in time. It needs to be woven into every stage of a GenAI system's life, from the first model benchmark to the last production trace.
What is the GenAI Observability Lifecycle?
Observability is not a feature you switch on at deployment. It runs from before the first model is selected to after the last interaction is analysed.
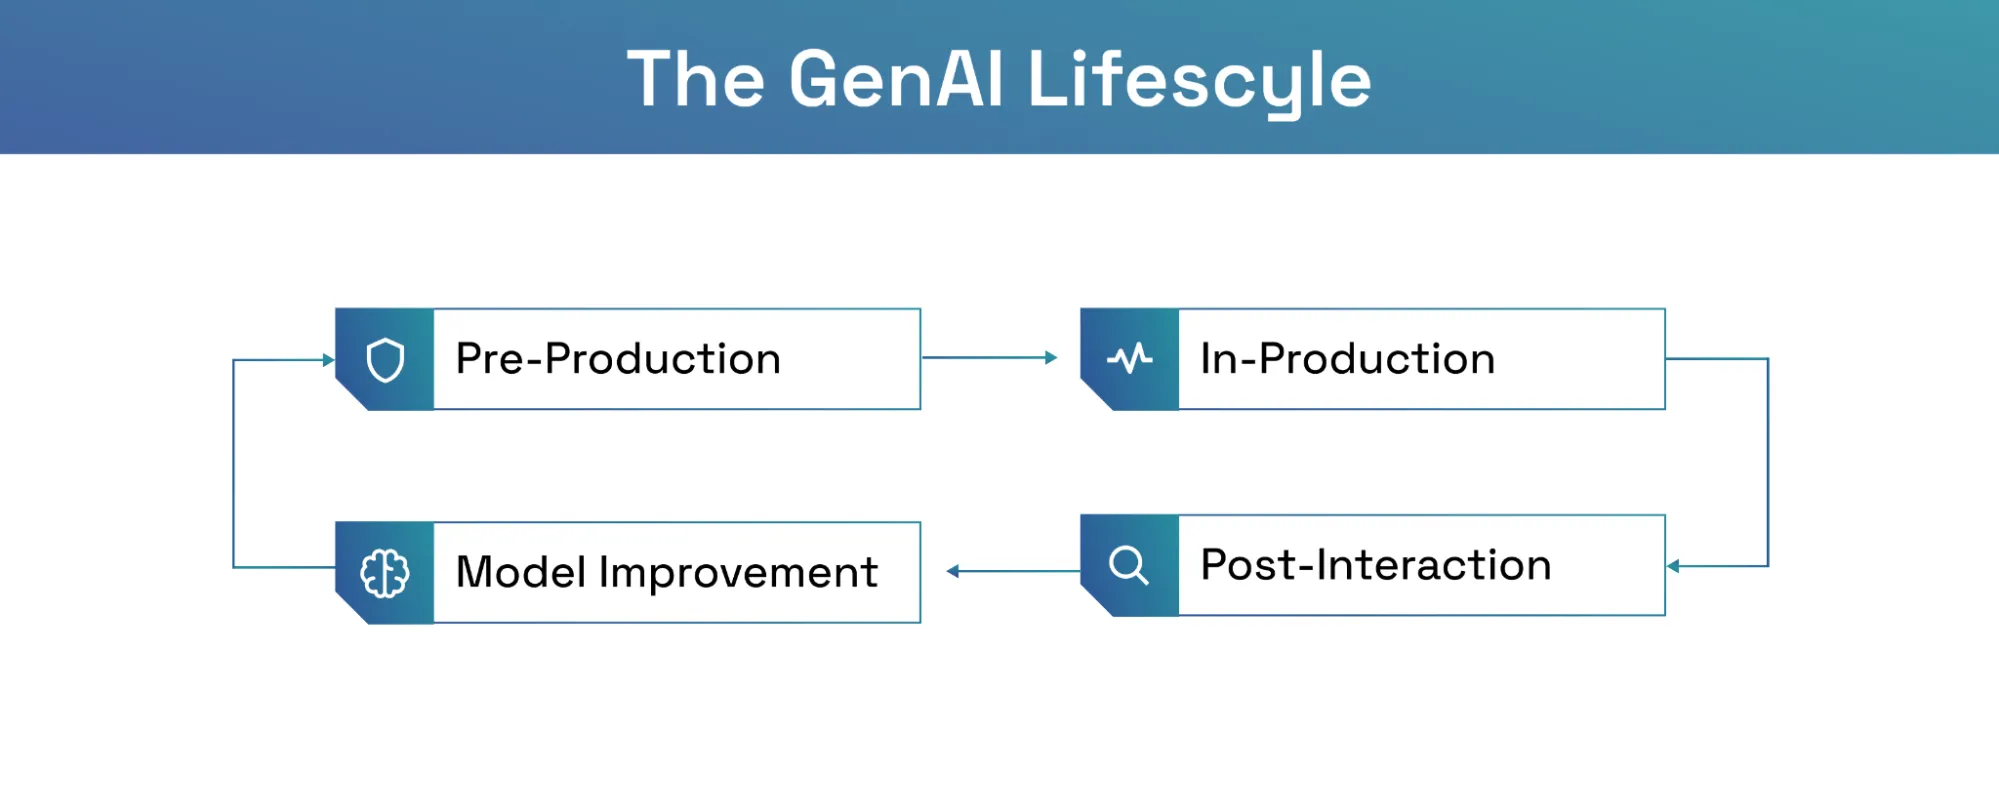
Pre-Production: Benchmarking and Red-Teaming
Before deployment, teams establish quality, safety, and performance baselines for the GenAI system.
Key activities
Benchmark model candidates against quality and safety baselines, run adversarial red-team testing before real users find vulnerabilities, and instrument observability before launch.
Why it matters
Production monitoring only works if the system already knows what good looks like. Without pre-production baselines, drift detection has no anchor.
Key outcome
Teams enter production with measurable reference points for safety, quality, latency, and compliance.
In-Production: Real-Time Monitoring and Alerting
Once live, observability shifts into continuous mode across all pipeline components.
How the system responds to different alert types:
Key outcome
Trace data enables rapid incident diagnosis, cutting the time from alert to root cause significantly.
Post-Interaction: Analysis and Continuous Improvement
Production traces become the raw material for the next improvement cycle.
Key activities
Generate real-world evaluation datasets from production traces, surface failure patterns across sessions and users, and inform prompt updates, retrieval index refreshes, and model version decisions.
Key outcome
Observability graduates from a diagnostic tool into a continuous improvement engine, feeding every upstream decision with evidence from production reality.
Once organisations understand the lifecycle of observability, the next challenge becomes operational: how do you instrument these capabilities across real-world GenAI architectures?
How to Implement GenAI Observability?
Moving from theoretical observability to a production-ready implementation requires selecting an architecture pattern that balances data granularity with system performance. Most enterprise deployments utilize a hybrid of the following patterns:
Most production deployments combine two or more of these patterns depending on the architecture.
Integrating with Popular Frameworks
LangChain provides observability callbacks that capture execution traces without modifying core application logic. LlamaIndex has its own native instrumentation for pipeline-level tracing. Haystack supports tracing integration for search and retrieval workflows. For custom frameworks, OpenTelemetry-based layers provide standardised observability without lock-in.
Setting Up Dashboards
Observability data must be visualized according to the specific needs of the audience. A single dashboard cannot satisfy both a DevOps engineer and a Compliance officer.
Configuring Alerts
Three alert types cover most production failure scenarios.
- Threshold-based: Fires when a metric crosses a defined boundary: latency exceeding P95, error rate above one percent. Clear, deterministic, easy to set.
- Anomaly-based: Detects unusual patterns that do not cross a fixed threshold but deviate from historical norms. Catches slow degradation that threshold alerts miss entirely.
- Composite: Combines multiple signals to reduce false positives. High latency during a traffic spike may be acceptable. High latency combined with a rising error rate and a dropping grounding score is not.
Alert fatigue is a real risk. Escalation policies by severity keep teams focused on what actually matters.
Even with the right architecture in place, most teams encounter the same set of obstacles when operationalising GenAI observability.
What are the Key Challenges in GenAI Observability?
Most teams encounter the same set of obstacles when operationalising GenAI observability. Knowing them in advance makes them easier to navigate.
1. Data Volume and Storage Costs
High-traffic deployments generate log volumes that escalate storage costs rapidly. Logging every prompt, response, and intermediate step across thousands of daily interactions adds up quickly.
Intelligent sampling strategies and tiered retention policies manage volume without sacrificing the ability to investigate specific incidents.
2. Privacy and Security
Prompt and response logs may contain sensitive user data. Retrofitting privacy controls onto an existing log store is significantly more costly and less reliable than designing them in from the start.
Redaction pipelines, access controls, and retention policies need to be architectural decisions made before the first log is written, not after the first audit.
3. Instrumentation Overhead
Observability instrumentation can affect the very latency metrics it is trying to measure, introducing noise into performance baselines.
Asynchronous logging and lightweight instrumentation approaches minimise performance impact without sacrificing signal coverage.
4. High Cardinality Metrics
Breaking metrics down simultaneously by user, session, prompt version, and model configuration strains standard time-series databases and can make dashboards slow and unreliable.
Purpose-built observability platforms designed for high-cardinality workloads handle this more gracefully than general-purpose monitoring tools.
5. Evaluating Evaluation Quality
If LLM-as-a-judge is the evaluation mechanism, the recursive question of who evaluates the evaluator applies. A poorly calibrated judge model produces misleading quality scores at scale.
Human calibration studies, consistency testing across prompt types, and full transparency in the scoring methodology are the necessary controls.
6. Correlation Across Distributed Systems
In multi-model, multi-provider architectures where a single user interaction may span several services, connecting signals across systems without a shared trace identifier is nearly impossible.
Consistent trace ID propagation across all components is the prerequisite for making cross-system correlation work reliably.
With the challenges mapped, it is worth addressing a question that comes up in almost every conversation about this topic: if observability and monitoring are both about understanding system behaviour, what is actually different between them?
How is GenAI Observability Different from GenAI Monitoring?
The terms are used interchangeably, but they describe fundamentally different things and the distinction matters for how you build your programme.
Observability is the capability: the instrumentation, data collection, and tooling that makes a system understandable from the outside. Monitoring is the practice: the act of continuously checking defined metrics against thresholds and responding when they are breached.
The dependency only runs one way. Monitoring requires observability to be meaningful, forming the foundation for effective GenAI model monitoring. Without the underlying instrumentation, there is nothing worth monitoring. Teams that invest in monitoring without first investing in observability end up with dashboards that tell them something is wrong but not why. The investment order matters.
For engineering teams, that distinction is enough. But for risk officers, compliance leads, and boards, there is a further question: how does all of this observability data connect to the governance obligations that regulated organisations are operating under?
How Does GenAI Observability Connect to Governance?
Observability produces the data. Governance determines what happens with it. For engineering teams, observability is a debugging tool. For risk and compliance teams, it is an evidence layer.
In regulated industries, observability data does not just help teams fix problems faster. It becomes the audit trail that satisfies regulators, the evidence that demonstrates compliance, and increasingly, the difference between a GenAI programme that earns trust and one that loses it.
Observability as Regulatory Evidence
Trace logs, evaluation scores, and audit trails directly satisfy the transparency, traceability, and post-market monitoring requirements of the EU AI Act for high-risk AI use cases. SR 11-7 documentation obligations and PRA SS1/23 governance expectations extend to the GenAI layer, and observability data is what makes compliance demonstrable rather than merely asserted.
Observability as the Trigger for Governance Workflows
A quality breach triggers an incident workflow. A prompt change triggers a change approval. A drift signal triggers a retraining review. Organisations that treat observability as a technical discipline without connecting it to governance workflows are capturing the data without acting on it.
How Solytics Partners Delivers GenAI Observability?
GenAI observability is the prerequisite for understanding what AI systems are doing in production, why they are doing it, and whether it is acceptable. Without it, quality problems go undetected, costs run unchecked, and the evidence trail regulators require simply does not exist.
Solytics Partners has built NIMBUS Uno and MRM Vault as a unified platform that covers both sides of this equation: the engineering observability layer that captures the signals, and the governance layer that acts on them.
NIMBUS Uno is the core GenAI observability platform. The five proprietary modules each address a specific layer:
- Trace IQ: End-to-end pipeline tracing
- Chat Intel: Session-level quality and safety monitoring
- Embedding Insights: Semantic drift detection and RAG coverage analysis
- Drift Lens: Topical and behavioural drift detection
- Metrics Mind: Custom KPI computation
PromptEval Lab connects observability data to transparent, auditable LLM-as-a-judge evaluation and A/B prompt testing, directly addressing the black-box-judging-a-black-box problem.
MRM Vault turns observability signals into governance evidence through audit trails, regulatory reporting, and workflow-triggered remediation, aligned to the EU AI Act, SR 11-7, OSFI E-23, and PRA SS1/23.
Where does your organisation sit today?
The organisations that build observability into their GenAI programmes from the start, rather than retrofitting it after problems surface, will scale more responsibly, respond to incidents faster, and demonstrate the transparency that stakeholders increasingly expect.
Most organisations already have GenAI in production. Very few can explain exactly why their systems behave the way they do. See how NIMBUS Uno gives teams trace-level visibility, evaluation intelligence, and governance-ready auditability across the entire GenAI lifecycle.
Frequently Asked Questions on GenAI Observability
What is eval in GenAI?is GenAI observability?
GenAI observability is the ability to monitor, understand, and troubleshoot AI systems by collecting and analysing traces, logs, metrics, and evaluation scores across the full lifecycle of a generative AI application.
What is eval in GenAI?
Eval, or evaluation, in GenAI is the systematic assessment of model output quality against defined criteria including factual accuracy, groundedness, safety, relevance, and coherence. It can be automated using LLM-as-a-judge approaches, reference-based metrics, or human review, and is most effective when it operates on production data captured through observability instrumentation.
What is the minimum observability instrumentation a team needs before going live with a GenAI system?
The minimum a team needs before going live is trace-level logging of prompts and responses, latency and error rate metrics, a baseline evaluation dataset with quality scores, and structured logs with sufficient context to support incident investigation. Cost-per-request monitoring should be included from day one, particularly for token-heavy use cases.
How does observability differ for RAG systems vs. standalone LLMs?
Observability for RAG systems requires coverage at two layers: the retrieval layer covering index quality, recall, and latency, and the generation layer covering grounding score, hallucination rate, and citation accuracy. For standalone LLMs, only the generation layer applies, but the absence of retrieval makes factual accuracy monitoring more dependent on evaluation scoring.
How do you use observability data to improve GenAI output quality over time?
Improving output quality over time starts with production traces and evaluation scores, which are used to generate new evaluation datasets from real-world interactions, identify systematic failure patterns, and inform prompt updates, retrieval index refreshes, and model version decisions. This feedback loop is how observability becomes a continuous improvement engine rather than just an incident response tool.
What should a GenAI observability dashboard show to a risk or compliance team vs. an engineering team?
For a risk or compliance team, a GenAI observability dashboard should surface audit trails, policy violation rates, bias detection events, and regulatory evidence. For an engineering team, it should show latency breakdowns, error rates, token consumption, and trace-level diagnostic tools. The underlying data is the same; the presentation and access controls differ by audience.
How does GenAI observability support incident response when a model produces a harmful output?
When a model produces a harmful output, observability provides the trace connecting that output to the exact prompt version, retrieval context, and model configuration that produced it. This makes it possible to identify the root cause, assess the scope of impact, implement a targeted fix, and produce the incident report that governance and regulatory processes require.
How does observability fit into an agentic AI governance framework?
In an agentic AI governance framework, observability needs to extend beyond individual model calls to cover tool use, inter-agent communication, and decision point auditing. Trace-level visibility across the full agentic graph is the prerequisite for any meaningful governance of multi-step pipelines.

.webp)
.webp)
.svg)


